![DNA-B-Primary_White (7).png]](https://kb.dnabehavior.com/hs-fs/hubfs/DNA-B-Primary_White%20(7).png?height=50&name=DNA-B-Primary_White%20(7).png)
Financial DNA 5-scores
The Financial DNA 5-scores highlight the positives for how a client approaches investing and financial decision-making. Each of the scores are based on population percentages. This means that if a client were placed in a room with 99 other people, these scores would show how their behavior compares to that of others in the room. Higher scores indicate stronger behavior in a given area.
Alongside each score is a description of the client's approach. Rest assured, all the combinations of scores that clients may receive will be described positively in terms of their financial personality. Below are the 5 scores and the behavioral description for each.
- Risk Behavior: Comfort with taking higher risks (risk appetite)
- Financial Relationship Management: Time and energy required for working with this client
- Financial Planning Management: How financially organized a client is and if they are a saver or spender
- Wealth Building Motivation: Ability to set and ambitiously pursue goals
- Financial Emotional Intelligence: Able to effectively recognize and balance their impulses in not making decisions
Our team has done a deep dive into these scores in our Financial DNA 101 Knowledge base. Access it here.
The Descriptions:
Descriptors are narrative elements assigned to each score. These are not mere reflections of the numerical value but are derived from a complex analysis of various factors specific to each individual. Here’s how they function:
- Reflect Underlying Insights: Descriptors consider more than just the score; they delve into the nuances of behavior, preferences, and financial behavior insights.
- Provide Context: They offer a qualitative understanding of the scores, making them more relatable and actionable.
- Emphasize Individuality: Recognizing that each person's financial journey is unique, descriptors provide a personalized touch to the scores.
Scenarios of Score and Description Variations:
It's crucial to understand that scores and descriptors might not always align in the most straightforward manner. Here are a couple of scenarios you might encounter:- Different Scores, Similar Descriptors: Two clients may have different scores in a particular domain but receive similar descriptors. This happens when the underlying factors and insights resonate similarly despite the numerical differences in scores.
- Similar Scores, Different Descriptors: Conversely, clients might have close scores but differing descriptors. This scenario underscores the model's ability to capture subtle differences in behavior and attitude that aren't apparent from the scores alone.
Risk Behavior
Risk behavior is a measure of an individual's comfort level with taking higher risks, assessed on a scale of 0 to 100 based on population percentage. Based on a person's score, you can assess if they are in the High or Low range (or are in the middle of risk like most people).
- Low scores (under 30): suggest that an individual is more cautious with risk and tends to manage it safely. They prefer to have a contingency plan and are more comfortable in known situations or after a decision is made.
- High scores (over 70): indicate a willingness to take risks and tolerate losses. These individuals are comfortable in uncertain situations and like to see higher rewards for higher risks.
It is important to note that risk behavior is not limited to financial decisions and could extend to various activities such as adventure sports or traveling to risky destinations. By understanding an individual's risk behavior, one can gain insight into their decision-making process and potential response to various situations.
Risk Group and Portfolio Structure:
Alongside a client's risk behavior score is their Risk Group and Portfolio Structure. We go into those in depth in our Financial DNA 101 knowledge base. Access it here.
Style Match
The Style Match Insight measures the relative distance between two individuals. This insight card shows the degree of similarity or difference between them as a percentage, with scores ranging from 0 to 100%. Higher scores indicate a strong similarity, which suggests good compatibility when working together. Conversely, lower scores suggest the need for adjustments in styles to facilitate collaboration.
Tip: Top wealth management firms utilize this insight to match clients with advisors who have a high match score.
This insight adapts to the user's selection on the screen. If you are viewing insights for one person, the Style Match Card compares you (the logged-in user) and the other individual. If you are viewing insights for two people, the Style Match Card compares the two individuals.
Market Mood
Market Mood measures the current level of market fear or exuberance for each investor based on real-time market indices data or client’s specific portfolios. This tool provides easy-to-understand behavioral management tips and action items for investment advisors (and Fintech applications) to behaviorally manage or “nudge” their clients, in a way that is tailored to each client via automated customization.
There are eight different moods that clients can be tagged to. These moods are represented with four colors to easily demonstrate the level of urgency for financial services teams.
Moods, when investment returns are positive:
– Comfortable
– Exuberant
– Watchful
– Apprehensive
Moods, when investment returns are negative:
– Comfortable
– Opportunistic
– Concerned
– Fearful
Learn more about Market Mood here.
Behavioral Biases
Financial Behavior Biases are inclinations around financial decisions. The behavioral bias insights consist of 16 insights, all based on population percentages. This means that if a client were placed in a room with 99 other people, these scores would show how their behavior compares to that of others in the room. Higher scores indicate stronger behavior in a given area.
Financial DNA has extensive research and documentation of the practical use of behavioral biases. Learn more here.
T-Scores
The DNA Web App displays T-scores for the eight factors in two views: Factors and Sub-Factors. Factors show up first and represent the main factor categories of our T-scores. To see the sub-factors, select the button in the top right-hand corner of this card.
T-scores for the eight factors are based on the Normal Distribution Curve. Factor scores range from 20 (left side) to 80 (right side). Most people fall near the center of the graph rather than near the outside. Note that approximately one-third of the population will score in the Mid-Range (45-55), shaded in green, and one-third will score on the Left and one-third on the Right side.
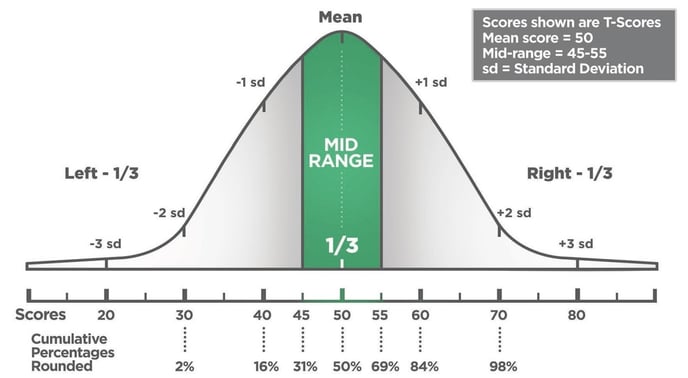
As the scores move left or right of 50, the strengths and struggles of the trait on either side become more pronounced. Strong scores (under 40 and over 60) indicate more intense behavioral tendencies, particularly under pressure or when making important decisions.
Communication Keys
This insight card lists communication keys when communicating with a person. These insights are recommendations for how someone could adjust their communication style to best interact with an individual.
These insights become particularly crucial in scenarios where two users have low Style Match Insight scores.
Want to create magical connections with clients?
Gene AI is trained to create customized talking scripts based on behavioral traits. Explore Gene AI's script prompts to get started.
Strengths
The Strengths Insight Card showcases the behavioral strengths that correspond with a person's two strongest factors. These insights can be used to identify how an individual can stand out both professionally, personally, or when making financial decisions.
Struggles
The Struggles Insight Card showcases the behavioral struggles that correspond with a person's two strongest factors. These insights can be used to identify areas where this person may not necessarily excel, these areas can become draining or take longer than others to complete.
Contact Methods
The Preferred Contact Methods card, inspired by Communication DNA, lists the contact method that a person would likely appreciate for communication.
Still Need Help?
Submit a ticket here.