![DNA-B-Primary_White (7).png]](https://kb.dnabehavior.com/hs-fs/hubfs/DNA-B-Primary_White%20(7).png?height=50&name=DNA-B-Primary_White%20(7).png)
Common Causes/Issues:
What factors and subfactors are scored with the Natural DNA Behavior Discovery?
How are those scores interpreted?
What does a factor and subfactor score mean?
Solution Overview:
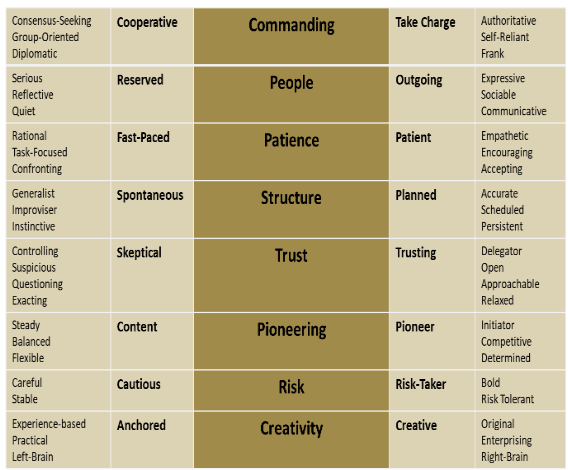
The Factor and Subfactor report provides a detailed “MRI Scan” of who you are based on 32 individual measurements of your behavior.
The DNA Behavior Natural Behavior Discovery measures eight primary factors expressed in sixteen behavioral traits shown on the left and right-hand sides of the graphic in the Factor and Subfactor Report.
In addition, twenty-four subfactor scores are measured.
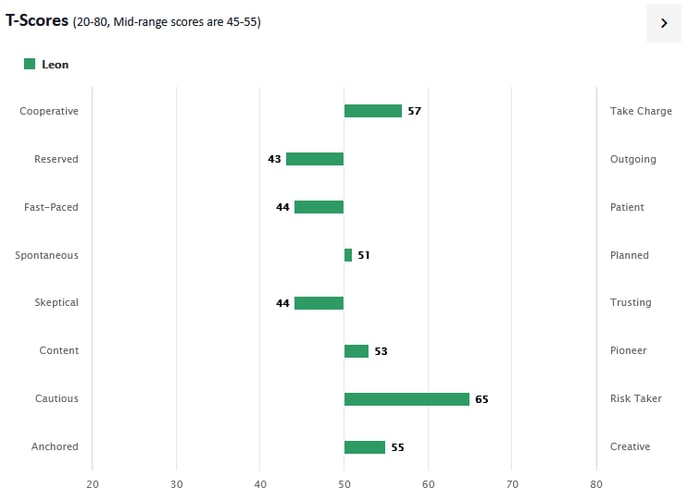
The eight Primary Factors measured are:
Commanding – measures the spectrum between Cooperative and Take charge
People – measures the behavioral range between Reserved and Outgoing
Patience – measures the behavioral spectrum between Fast-paced and Patient
Structure – measures the behavioral spectrum between Spontaneous and Planned
Trust – measures the behavioral spectrum between Skeptical and Trusting
Pioneering – measures the behavioral spectrum between Pioneering and Content
Risk - measures the behavioral spectrum between Risk-taking and Cautious
Creativity - measures the behavioral spectrum between Anchored and Creative
Further Details In Understanding the Factor Scores:
The factor scores are measured on a scale from 20 to 80. The closer to 50 these scores are, the easier it is to flex the trait. The closer to 20 or 80 the more effort it takes to flex that behavior. Only 2% of the population will have a score above 70 or below 30 in any factor.
- Strengths - Behaviors that come naturally and which should be used.
Note: Strengths overused can become a struggle. - Struggles – Behaviors that can be managed with greater awareness of your natural behaviors. Struggles not managed can become a weakness.
-
Strong Factor T-Scores (over 60 and under 40) – the closer to 20 or 80, the stronger the strength and struggle because there is more natural energy, and the harder it will be to adapt the behavior. The reports identify the 2 strongest T-Scores and are primarily driven by them.
-
Mid-Range Scores (between 45 and 55) - Tend to be more flexible in these factors. Easier to move left or right.
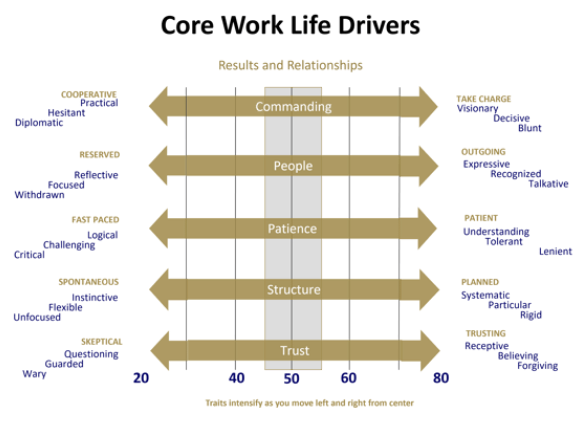
Core Work Life Drivers (Results and Relationships) – Behavioral patterns that impact how you approach results and relationships.
Commanding – Cooperative/Take-Charge
People – Reserved/Outgoing
Patience – Fast-Paced/Patient
Structure – Spontaneous/Planned
Trust – Skeptical/Trusting
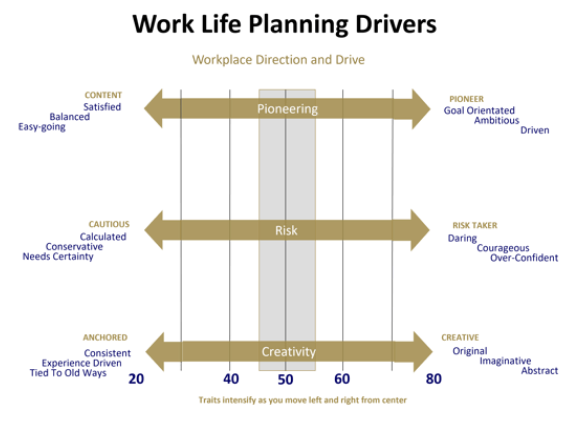
Work Life Planning Drivers (Growth and Life Balance) – How you approach work and goals.
People with the same or similar unique styles based on the top 5 factors may have different “Work Life Planning” drivers based on the bottom 3 factors causing them to work, live, interact, and decide very differently.
Pioneering – Content/Pioneering
Risk – Cautious/Risk-Taking
Creativity – Anchored/Creative
The twenty-four Subfactors measured:
In addition, associated with each of the 8 primary factors are 24 sub-factors measured on the left and right sides for each trait which identify specific behaviors relevant to how the primary behavioral factor will play out.
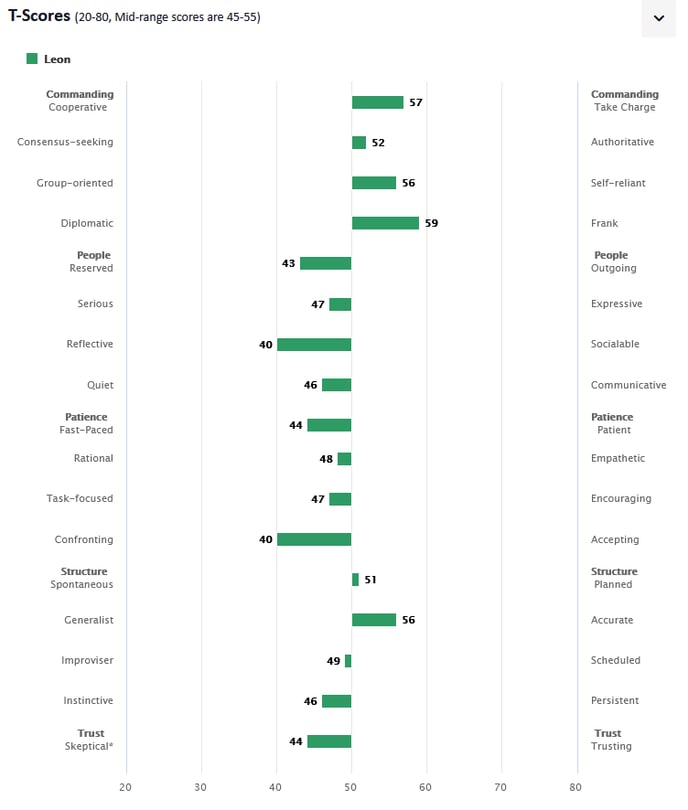
The sub-factor scores are individually measured with T Scores in the same way as the factors are.
The average of the sub-factors will not necessarily equal the relevant factor score because of their individual measurement.
It is likely that two people with the same unique DNA style and primary factor score(s) will have a different mix of sub-factors. This re-emphasizes that no two people are likely to be the same.
Reviewing and Facilitating the Factor and Sub-Factor Report:
Our recommendation is that you identify the two strongest factor scores based on those which have the closest T Scores to 80 or 20.
Our system is driven by the two strongest factors (for instance, to identify your strengths, struggles, and communication keys).
If the two strongest traits have T Scores over 60 or under 40 they are likely to be sufficiently strong to drive most of your behavior and override the less strong traits in many instances.
Also, when you combine the interaction of these stronger traits together, a clearer picture of how you work, live, interact and decide will be seen.
However, we acknowledge a person may have more than two strong traits with T Scores over 60 or under 40, with potentially up to five stronger traits that need to be addressed.
Then once you have identified the strongest behavioral traits with T Scores over 60 or under 40 then also review the subfactor scores to identify on a similar basis which ones are stronger and therefore may be influencing your behavior.
It is possible that associated with middle-range trait T Scores (between 45 and 55) there are stronger sub-factors that need to be addressed.
The Factor and Subfactor report is core to facilitating the following types of situations:
- Identity discovery
- Leadership, sales, employee, and advisor performance development
- Entrepreneurial talent review
- Change management
- Stress management
- Understanding client styles
- Communication and building enhanced relationships
- Building an enhanced relationship with money
- Team and Family Unit performance
Learn more with our Unlocking Behavior Guides:
Unlocking Financial Planning Performance Guide
Unlocking Human Capital Performance Guide
Related articles
Factors Strengths and Struggles Review
DNA Behavior Unique Styles
Advanced Insights - How Traits Combine
DNA Behavior and Adaptability