![DNA-B-Primary_White (7).png]](https://kb.dnabehavior.com/hs-fs/hubfs/DNA-B-Primary_White%20(7).png?height=50&name=DNA-B-Primary_White%20(7).png)
If you've opened a DNA Behavior report and seen a row of scores between 20 and 80, this explains what they are. If you're building on the DNA Behavior API or SDK, these scores are what the system returns underneath a result, so you'll need to understand them to interpret anything.
The quick version
Every DNA Behavior result is built on a set of underlying scores. These are the Factors and Subfactors. They are the raw measurements of a person's natural behavior, and everything else in the system, including a person's Unique Style, is built on top of them. If Unique Styles are the headline, Factors and Subfactors are the numbers behind it.
How the scores work
Each score runs from 20 to 80, and sits on a normal distribution curve. In plain terms, that means most people land near the middle, and fewer people sit at the extreme ends.
Roughly:
- A third of people score in the mid-range (45 to 55)
- A third score toward the left
- A third score toward the right
The curve below shows this. The middle band (45 to 55) is the mid-range where most people fall. The further left or right you go, the fewer people score there. Where someone lands tells you how strongly that behavior shows up in them compared to everyone else.
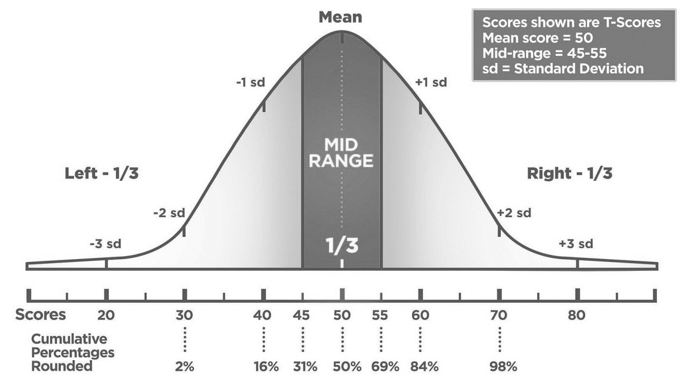
The scores are T-scores. The mean (average) is 50, and the mid-range is 45 to 55. The percentages along the bottom show how much of the population scores at or below each point. For example, a score of 60 means the person is higher than about 84% of people on that trait.
The eight Factors
Behavior is grouped into eight Factors:
- Commanding
- People
- Patience
- Structure
- Trust
- Pioneering
- Risk
- Creativity
Each Factor has two opposing traits. Which trait a person leans toward depends on whether they score to the left or right on that Factor, measured against the rest of the population. Subfactors sit beneath the Factors and break each one down further for more detail.
What is a T-score?
The 20-to-80 scale is a T-score. It's a standard way of scoring used in psychometrics, built on a population-weighted distribution with a midpoint of 50 and a standard spread of 10. You don't need the maths to use it, just remember: 50 is average, higher or lower means further from the middle in one direction.
Want to go deeper?
This article sits in the DNA Behavior Basics category. Read the Unique Styles article alongside it to see how these scores roll up into the 10 Styles, then work through the rest of the category for how it all applies in real settings.