![DNA-B-Primary_White (7).png]](https://kb.dnabehavior.com/hs-fs/hubfs/DNA-B-Primary_White%20(7).png?height=50&name=DNA-B-Primary_White%20(7).png)
The Factor and Subfactor Report in the DNA Web App provides administrators with detailed insights into the natural behaviors of participants. This article aims to guide administrators through the process of generating and interpreting the report, which consists of 32 scores divided into eight-factor groups. Understanding these scores will enable administrators to gain valuable information about individuals' behavior traits. Let's dive into the details.
Accessing the Factor and Subfactor Report:
-
Log into the DNA Web App and Select a User:
-
Choose the desired user from the user's list.
-
-
Accessing the Report:
-
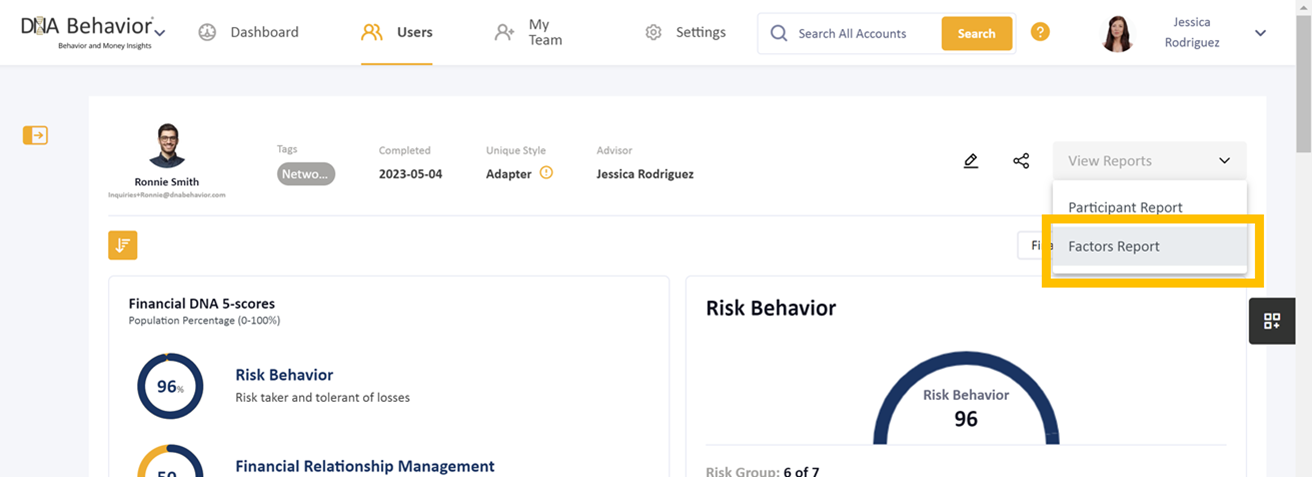
Once you have selected the user, locate the user menu on the right-hand side of the screen (see below).
-
Click on "View Reports" from the menu options.
-
In the drop-down menu, select the "Factors Report."
-
To Download the PDF report:
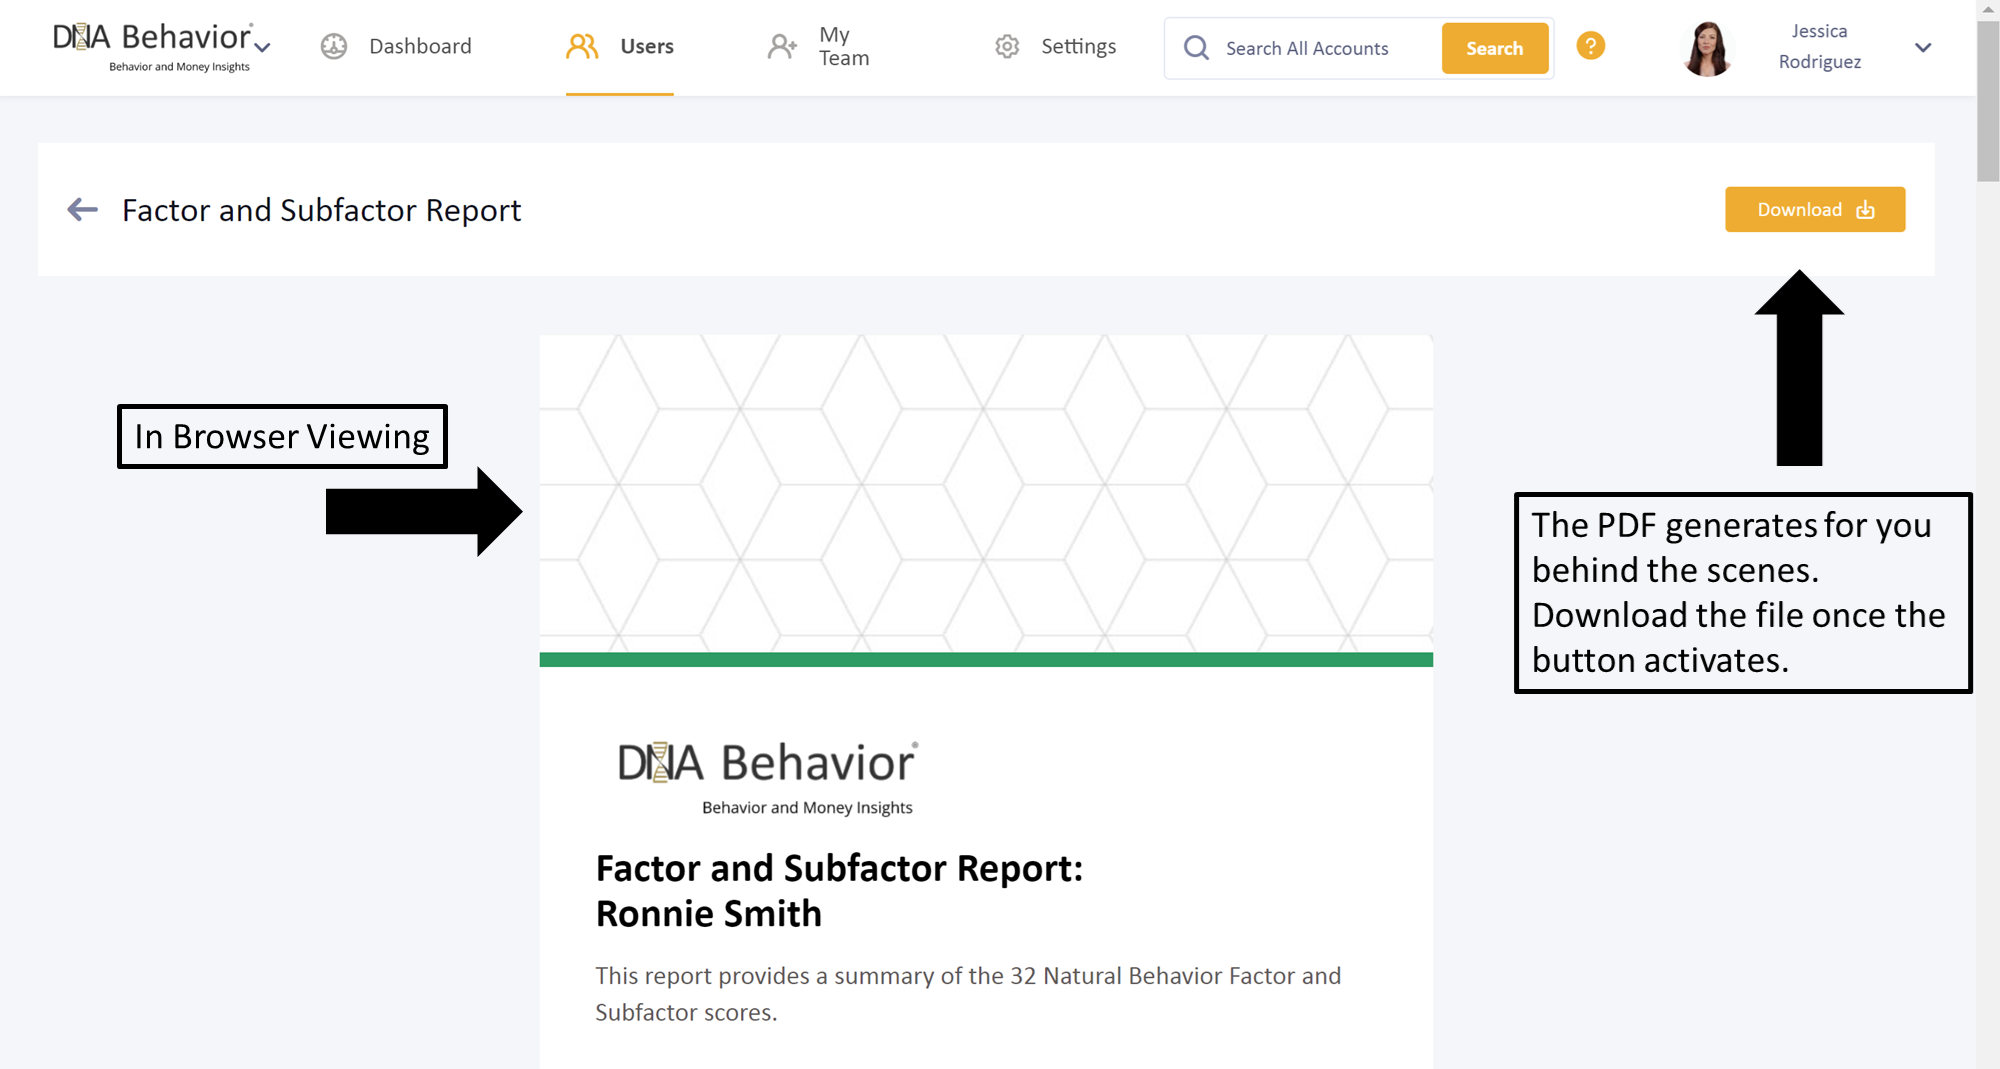
The PDF report will generate in the application's report viewer. Once the PDF file is ready to be downloaded, the "Download" button illuminates. Press the Download button, and then the report will be available in your browser's default download folder.
Understanding the Factor and Subfactor Report:
-
Report Overview: The Factor and Subfactor Report is a comprehensive 6-page document that provides insights into the natural behavior of participants.
-
Factor Grouping and Traits:
-
The 32 scores are divided into eight-factor groups.
-
Each factor group displays the respective traits on the left and right sides.
-
The overall factor score is listed first within each factor group, followed by the correlated subfactor scores.
-
-
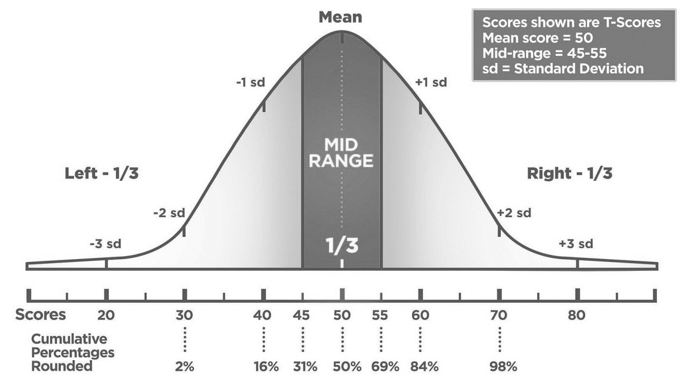
Natural Behavior T-Scores: The Natural Behavior T-scores are based on the Normal Distribution Curve. Scores range from 20 (on the left side) to 80 (on the right side) of the chart. Most individuals tend to score near the center of the chart. The Mid-Range (45-55) is shaded in dark grey and encompasses approximately one-third of the population. One-third of the population will score on the left side, while the other one-third will score on the right side.
Frequently Asked Questions about this report:
- Is this same information available in the app (but not in a PDF report)?
Yes, this same information is available in the "T-score" insights that are available on the Work Talents and Financial Behavior toggles on the user page. - Is this report similar to the 1-page Factor Report in the previous app?
In our previous system, there was a report called the 1-Page Factor Report. The scores highlighted in the 1-page Factor Report are consistent with the scores on the Factor and Subfactor Report, however, have expanded the new report to 6 pages to include similar information in an easier-to-use format. - Can I customize the name of this report on the report cover (like I can for other reports)?
No. This report cannot be customized as it's intended to be a facilitator report. You can request this feature if this is a functionality you would love to have. - Is this report available for participant's when they complete their discovery?
No. This report is not currently available for participants when they complete the discovery as it's intended to be a facilitator report. You can request this feature if this is a functionality you would love to have.
Want to learn more about the Factor, Subfactors, and Traits?
For more information about the Natural Behavior factors, our Knowledge Base article here.
Still Need Help?
Submit a ticket here.