![DNA-B-Primary_White (7).png]](https://kb.dnabehavior.com/hs-fs/hubfs/DNA-B-Primary_White%20(7).png?height=50&name=DNA-B-Primary_White%20(7).png)
Factors and Subfactors are underlying scores that help us understand the overall behavior of clients in the DNA system. These scores serve as the foundation for the various insights available within the DNA Web App. In this article, we will explore the Factors and Subfactors and guide you on how to interpret them effectively.
Population-weighted T-scores:
Factors and Subfactors are based on the Normal Distribution Curve, which means they are population-weighted. The scores range from 20 (on the left side) to 80 (on the right side). Most individuals tend to fall near the center of the graph rather than towards the extremes.
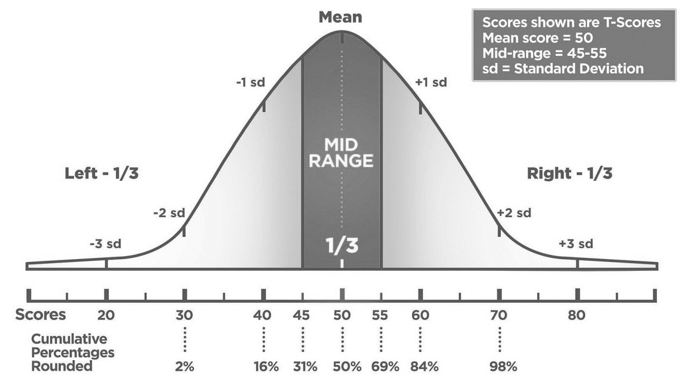
It's important to note that approximately one-third of the population will score in the Mid-Range (45 to 55), with another one-third scoring on the Left side and the final one-third scoring on the Right side. This distribution provides valuable insights into the natural behaviors of participants.
The Factors and Subfactors are categorized into eight-factor groups:
- Commanding
- People
- Patience
- Structure
- Trust
- Pioneering
- Risk
- Creativity
Each factor has 2 traits. Participants are associated with the traits based on how they score against the rest of the population.
What is a T-score?
T-scores are standardized scores used in psychometrics. They are scores based on a population-weighted distribution that has a mean of 50 and a standard deviation of 10.